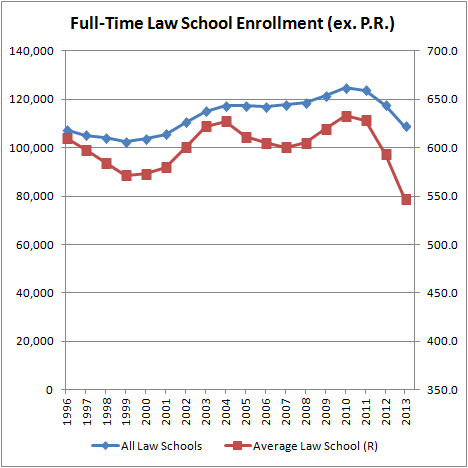
…Is the question of the day. The bigger question is, enrollment drop since when? Most of the time media outlets will report law schools’ cumulative percent declines since the overall enrollment peak in 2010, but those aren’t necessarily descriptive. It might be more valuable to measure enrollment declines since previous trough years. For the mean average law school, those would be 2007 and 1999.
(Source: Official Guide, 2013 data here (PDF), author’s calculations)
You might also want to ask, why not include part-time or post-J.D. students? There are a bunch of reasons, and laziness isn’t one of them. One, full-time programs are the bread and butter of law schools. Two, we care more about the younger crowd, who tend to be full-timers and are more likely to pay full tuition. Three, in any given year part-timers are not even 20 percent of all J.D. students. Nowadays, their share is even less… I could go on but I won’t.
If you remove the 23 law schools that were accredited since 1999 (!), the two average trough years remain the same, and the most-recent trough year for all law students moves from 2006 to 2007, which makes this analysis cleaner. Yay!
So, here’s a table of cumulative law school enrollment declines that’s sorted by the average of law schools’ 1999 and 2007 declines (not shown). Why that average? Because we want to see which law schools are really breaking from their enrollment trends. Schools like Quinnipiac, for example, have seen large enrollment drops since 1999, but not so much in 2007, meaning they shrank significantly in the previous decade and not more recently. I’ve also included the commonly used cumulative decline since 2010, as well as a ranking for that on the rightmost column.
********************
| # | LAW SCHOOL | 1999 DECLINE | 2007 DECLINE | 2010 DECLINE | 2010 RANK |
|---|---|---|---|---|---|
| 1. | Catholic | -47.7% | -43.7% | -39.1% | 5. |
| 2. | Tulsa | -42.5% | -43.8% | -31.0% | 15. |
| 3. | Seton Hall | -42.6% | -33.9% | -32.2% | 14. |
| 4. | Iowa | -38.1% | -35.1% | -28.4% | 21. |
| 5. | Case Western Reserve | -32.6% | -38.3% | -33.0% | 10. |
| 6. | Hamline | -30.8% | -37.4% | -32.9% | 12. |
| 7. | Western New England | -25.9% | -40.8% | -39.3% | 4. |
| 8. | Cleveland State | -31.8% | -34.8% | -27.6% | 23. |
| 9. | Wayne State | -35.9% | -30.6% | -30.7% | 17. |
| 10. | Golden Gate | -20.9% | -37.5% | -45.5% | 1. |
| 11. | New Hampshire | -24.5% | -32.3% | -35.3% | 8. |
| 12. | Kansas | -32.1% | -24.6% | -25.6% | 27. |
| 13. | Dayton | -28.8% | -24.1% | -38.5% | 6. |
| 14. | Widener | -29.6% | -21.3% | -30.9% | 16. |
| 15. | Capital | -21.1% | -29.0% | -32.9% | 11. |
| 16. | McGeorge | -29.3% | -20.3% | -32.3% | 13. |
| 17. | Samford | -30.2% | -17.4% | -16.7% | 62. |
| 18. | Florida, University of | -20.1% | -26.8% | -9.6% | 100. |
| 19. | Regent | -20.3% | -24.7% | -19.6% | 48. |
| 20. | Texas | -25.9% | -19.1% | -9.4% | 102. |
| 21. | Thomas M. Cooley | -16.6% | -27.9% | -44.1% | 3. |
| 22. | Temple | -23.8% | -20.3% | -24.6% | 32. |
| 23. | Wisconsin | -20.3% | -22.8% | -17.5% | 56. |
| 24. | Quinnipiac | -49.8% | 7.2% | -25.9% | 26. |
| 25. | Toledo | -24.1% | -18.4% | -22.2% | 42. |
| 26. | Missouri (Columbia) | -27.7% | -14.5% | -13.1% | 84. |
| 27. | Washburn | -17.5% | -23.8% | -25.3% | 28. |
| 28. | Ohio Northern | -17.2% | -24.1% | -24.6% | 31. |
| 29. | Boston University | -24.2% | -17.1% | -17.7% | 55. |
| 30. | Lewis and Clark | -16.7% | -23.8% | -22.7% | 39. |
| 31. | Gonzaga | -10.8% | -29.5% | -23.1% | 36. |
| 32. | Houston | -18.8% | -21.1% | -11.7% | 91. |
| 33. | New York Law School | -9.9% | -28.8% | -44.4% | 2. |
| 34. | Widener (Harrisburg) | -8.1% | -30.5% | -38.3% | 7. |
| 35. | Vermont | -13.2% | -24.0% | -30.5% | 18. |
| 36. | Southern Methodist | -28.0% | -6.8% | -4.6% | 140. |
| 37. | Albany | -15.2% | -19.2% | -23.2% | 34. |
| 38. | Villanova | -15.9% | -18.3% | -22.4% | 40. |
| 39. | Duquesne | -8.0% | -26.2% | -23.6% | 33. |
| 40. | Tulane | -26.8% | -7.3% | -9.4% | 103. |
| 41. | Memphis | -19.5% | -14.2% | -16.9% | 60. |
| 42. | California Western | -9.1% | -23.0% | -26.1% | 25. |
| 43. | Brooklyn | -8.3% | -23.4% | -29.7% | 20. |
| 44. | Oregon | -13.8% | -17.4% | -17.1% | 58. |
| 45. | Pittsburgh | -13.9% | -17.4% | -20.2% | 47. |
| 46. | Oklahoma | -20.6% | -9.4% | -14.0% | 78. |
| 47. | Texas Southern | -20.3% | -8.6% | -6.7% | 127. |
| 48. | Syracuse | -20.7% | -8.2% | -4.7% | 137. |
| 49. | Seattle | -6.8% | -21.9% | -18.3% | 53. |
| 50. | George Mason | -0.5% | -27.8% | -28.1% | 22. |
| 51. | SUNY Buffalo | -8.2% | -18.6% | -12.4% | 86. |
| 52. | Penn State | -9.4% | -17.1% | -23.0% | 37. |
| 53. | Rutgers (Camden) | -16.2% | -9.8% | -11.7% | 92. |
| 54. | St. Mary’s | -16.4% | -9.4% | -6.2% | 129. |
| 55. | San Francisco | -7.6% | -17.1% | -21.7% | 45. |
| 56. | Ohio State | -10.0% | -14.2% | -17.2% | 57. |
| 57. | St. Louis | 1.6% | -25.5% | -30.1% | 19. |
| 58. | West Virginia | -8.9% | -14.2% | -7.3% | 123. |
| 59. | Arizona | -11.8% | -10.8% | -13.9% | 81. |
| 60. | Willamette | -12.3% | -9.6% | -15.8% | 67. |
| 61. | Creighton | -6.6% | -15.3% | -16.8% | 61. |
| 62. | Alabama | -15.9% | -5.5% | -8.6% | 110. |
| 63. | California-Hastings | -5.9% | -14.3% | -16.5% | 64. |
| 64. | Illinois | -12.0% | -7.5% | -15.2% | 71. |
| 65. | South Carolina | -12.6% | -6.9% | -9.1% | 105. |
| 66. | Brigham Young | -8.8% | -9.8% | -7.0% | 125. |
| 67. | Boston College | -12.1% | -6.4% | -8.5% | 112. |
| 68. | Florida State | -4.1% | -14.3% | -15.9% | 66. |
| 69. | Akron | -12.6% | -5.2% | 4.7% | 179. |
| 70. | Connecticut | 0.2% | -16.9% | -8.6% | 111. |
| 71. | Missouri (Kansas City) | -7.0% | -9.2% | -7.6% | 117. |
| 72. | California-Davis | -2.3% | -13.5% | -15.3% | 70. |
| 73. | Denver | -1.3% | -14.4% | -4.7% | 138. |
| 74. | Utah | -4.1% | -10.8% | -11.9% | 90. |
| 75. | Virginia | -3.9% | -10.8% | -5.2% | 134. |
| 76. | Tennessee | -8.7% | -5.8% | -8.3% | 113. |
| 77. | Santa Clara | 0.2% | -14.3% | -16.7% | 63. |
| 78. | Pepperdine | -9.2% | -4.9% | -9.7% | 98. |
| 79. | Southern Illinois | -10.5% | -3.4% | -10.5% | 97. |
| 80. | Mississippi | -2.9% | -10.8% | -10.7% | 96. |
| 81. | St. John’s | -2.9% | -10.3% | -12.2% | 88. |
| 82. | Notre Dame | -5.5% | -7.6% | -7.8% | 115. |
| 83. | DePaul | -8.3% | -3.4% | -15.6% | 68. |
| 84. | William Mitchell | 10.4% | -21.9% | -17.1% | 59. |
| 85. | City University | -2.8% | -8.3% | -13.7% | 83. |
| 86. | Richmond | -4.0% | -6.4% | 0.7% | 171. |
| 87. | Northeastern | -1.6% | -8.8% | -9.5% | 101. |
| 88. | Michigan | -1.6% | -8.5% | -7.4% | 122. |
| 89. | Cincinnati | -7.0% | -3.1% | -15.4% | 69. |
| 90. | Arkansas (Fayetteville) | -0.5% | -9.1% | -5.1% | 135. |
| 91. | Wyoming | -6.0% | -3.1% | -4.3% | 141. |
| 92. | District of Columbia | 12.5% | -20.3% | -26.2% | 24. |
| 93. | Indiana (Indianapolis) | 2.7% | -10.2% | -2.4% | 154. |
| 94. | Minnesota | 2.3% | -9.1% | -4.1% | 143. |
| 95. | San Diego | 3.1% | -9.4% | -16.2% | 65. |
| 96. | Georgia | -3.0% | -3.3% | -11.7% | 93. |
| 97. | Hofstra | -0.2% | -5.6% | -13.1% | 85. |
| 98. | Nova Southeastern | 0.0% | -5.7% | -18.8% | 52. |
| 99. | Kentucky | 0.0% | -5.6% | -4.1% | 145. |
| 100. | Hawaii | 1.7% | -7.0% | -19.0% | 51. |
| 101. | Nebraska | 0.0% | -4.8% | -8.3% | 114. |
| 102. | Vanderbilt | 1.1% | -5.8% | -3.4% | 150. |
| 103. | Loyola Marymount (CA) | -1.7% | -2.8% | -3.8% | 146. |
| 104. | Louisiana State | -8.2% | 3.7% | -5.0% | 136. |
| 105. | Drake | 8.0% | -12.3% | -19.5% | 49. |
| 106. | Pace | 6.7% | -10.3% | -22.1% | 43. |
| 107. | Rutgers (Newark) | 3.2% | -6.3% | -14.3% | 77. |
| 108. | California-Los Angeles | 1.9% | -4.9% | -2.4% | 153. |
| 109. | George Washington | 5.9% | -8.9% | -8.7% | 109. |
| 110. | New Mexico | -1.7% | -0.9% | -2.0% | 157. |
| 111. | Illinois Institute of Technology | -3.9% | 1.6% | -2.8% | 151. |
| 112. | Howard | 2.8% | -4.9% | -14.0% | 79. |
| 113. | Oklahoma City | 14.0% | -15.6% | -25.0% | 29. |
| 114. | Maine | -0.8% | -0.4% | -9.0% | 107. |
| 115. | Maryland | 4.2% | -5.2% | -12.4% | 87. |
| 116. | Washington University | 13.6% | -14.2% | -23.1% | 35. |
| 117. | Southern California | -1.0% | 0.7% | -7.5% | 118. |
| 118. | Loyola (LA) | 16.9% | -17.0% | -14.7% | 75. |
| 119. | California-Berkeley | 1.1% | -1.2% | -6.8% | 126. |
| 120. | Texas Tech | 7.6% | -7.5% | -4.6% | 139. |
| 121. | Stetson | 8.7% | -8.4% | -19.1% | 50. |
| 122. | Colorado | 4.7% | -3.0% | -5.9% | 131. |
| 123. | Mississippi College | 18.6% | -16.9% | -18.1% | 54. |
| 124. | Montana | 6.4% | -2.0% | -2.7% | 152. |
| 125. | Pennsylvania | 4.2% | 0.5% | -2.0% | 156. |
| 126. | Harvard | 5.2% | 0.4% | 0.5% | 169. |
| 127. | South Dakota | 12.5% | -6.8% | 2.0% | 174. |
| 128. | Duke | -2.0% | 7.9% | -2.3% | 155. |
| 129. | Northern Illinois | 11.9% | -5.8% | -9.0% | 106. |
| 130. | New York University | 6.8% | -0.4% | -0.9% | 163. |
| 131. | Mercer | 7.2% | -0.7% | 1.4% | 173. |
| 132. | Miami | 15.6% | -8.8% | -14.4% | 76. |
| 133. | Baltimore | 8.1% | -0.9% | -10.8% | 95. |
| 134. | Columbia | 6.9% | 1.0% | -7.1% | 124. |
| 135. | Indiana (Bloomington) | 4.9% | 3.1% | -1.2% | 161. |
| 136. | Suffolk | 5.4% | 2.9% | -3.6% | 148. |
| 137. | North Carolina | 5.4% | 3.0% | -7.5% | 119. |
| 138. | New England | 14.2% | -5.5% | -15.1% | 72. |
| 139. | Chicago | 8.3% | 0.8% | -3.5% | 149. |
| 140. | South Texas | 10.4% | -0.2% | -7.4% | 120. |
| 141. | Idaho | 7.5% | 2.9% | -9.2% | 104. |
| 142. | Cardozo | 7.4% | 3.7% | -4.1% | 144. |
| 143. | Washington | 8.9% | 2.5% | -1.6% | 159. |
| 144. | Southwestern | 13.4% | -1.7% | -7.4% | 121. |
| 145. | Stanford | 5.3% | 6.7% | 0.5% | 170. |
| 146. | Wake Forest | 6.4% | 6.6% | -1.0% | 162. |
| 147. | Arizona State | 17.9% | -4.7% | -7.7% | 116. |
| 148. | Cornell | 10.6% | 3.6% | -1.8% | 158. |
| 149. | Whittier | 5.7% | 8.9% | -14.7% | 74. |
| 150. | Yale | 8.5% | 6.7% | -0.6% | 167. |
| 151. | Northwestern | 17.4% | -1.0% | -6.6% | 128. |
| 152. | William and Mary | 15.8% | 1.0% | -0.8% | 165. |
| 153. | Arkansas (Little Rock) | 17.8% | -0.3% | -13.9% | 80. |
| 154. | Georgia State | 18.7% | -0.8% | 2.6% | 176. |
| 155. | Washington and Lee | 14.8% | 6.1% | 2.9% | 177. |
| 156. | Fordham | 29.0% | -6.9% | -8.9% | 108. |
| 157. | Valparaiso | 26.0% | -1.2% | -9.6% | 99. |
| 158. | Western State | 16.7% | 8.1% | -11.9% | 89. |
| 159. | North Dakota | 28.2% | -3.2% | -5.9% | 132. |
| 160. | Touro | 37.3% | -11.7% | -24.6% | 30. |
| 161. | John Marshall (Chicago) | 34.9% | -9.1% | -13.8% | 82. |
| 162. | St. Thomas (FL) | 27.9% | -0.3% | -15.0% | 73. |
| 163. | Georgetown | 25.3% | 5.5% | 4.2% | 178. |
| 164. | Thomas Jefferson | 43.5% | -5.7% | -20.2% | 46. |
| 165. | Marquette | 30.6% | 9.6% | -0.7% | 166. |
| 166. | Loyola (IL) | 31.0% | 9.7% | -1.6% | 160. |
| 167. | American | 42.0% | -0.5% | -0.2% | 168. |
| 168. | Louisville | 30.6% | 12.4% | -4.2% | 142. |
| 169. | Emory | 31.7% | 14.4% | 2.4% | 175. |
| 170. | Michigan State | 38.8% | 9.1% | -5.6% | 133. |
| 171. | Roger Williams | 81.0% | -24.5% | -22.2% | 41. |
| 172. | Texas Wesleyan | 59.0% | 5.9% | -3.7% | 147. |
| 173. | Campbell | 42.1% | 24.5% | -6.2% | 130. |
| 174. | Southern University | 52.1% | 27.9% | -0.8% | 164. |
| 175. | Northern Kentucky | 80.4% | 9.2% | -11.5% | 94. |
| 176. | Detroit Mercy | 115.5% | -24.5% | -22.0% | 44. |
| 177. | North Carolina Central | 94.5% | 3.8% | 1.0% | 172. |
| 178. | Chapman | 326.3% | -11.0% | -22.7% | 38. |
| 179. | Florida Coastal | 367.9% | -9.9% | -34.1% | 9. |
| TOTAL | -1.0% | -10.0% | -13.5% | ||
| MEAN AVERAGE | 4.0% | -10.0% | -13.8% | ||
| MEDIAN AVERAGE | -1.6% | -8.6% | -11.9% | ||
Some observations:
- Florida Coastal is the real oddball because it’s been league average since 2007 but is way higher than 1999 when it began its expansion phase. Nevertheless, it’s in the top-10 for cumulative full-time enrollment declines since 2010. I’m fine with this result as the goal of this exercise is to find which “established” schools had the most consistent enrollment declines, and newer schools, especially freestanders and for-profits, aren’t very typical. Nor, for that matter, are schools that rely heavily on part-time students.
- A bunch of the schools at the top of the list never really benefited from the 2010 peak, which shouldn’t be too surprising if you think about it.
- Elite law schools tend to be at the bottom of both rankings columns, showing that they have much more control over their student bodies than non-elite schools.
- I’m a little surprised to see Iowa and Wisconsin so high up the list. Texas’ case is a little different, I think, because it may’ve tried to become more selective over the years.
- Can’t say the same about Case Western or Seton Hall, given what some of their faculty have been saying publicly, but that’s just synthesis via cynicism.
- Also can’t say the same thing about Boston University; it consistently has a low acceptance rate and a low matriculation yield, implying that it’s everyone’s safety school. There are a few schools in U.S. News‘ 10-30 that are fairly similar (Southern California, Boston College, George Washington, Georgetown, Duke, etc.), but they appear to be doing better than BU.
- Another way I may do this exercise in the future is to sort the schools by statistical area. It might help illuminate which local schools are more popular than others, regardless of what the rankings say.
- As many as 11 law schools have seen a positive cumulative enrollment changes since 2010.
- 83 schools have positive cumulative enrollments since 1999, but don’t worry, almost all of them have larger full-time faculties and the ones that don’t may’ve submitted erroneous faculty data to the Official Guide.
That’s all I’ve got. Peace.

LOL at Seton Hall. Maybe they should try stuffing their glossy brochures with the S&M study…
They’re not?
I wonder if they mention that their finances almost made the school terminate his job last year?