[UPDATE: April 3, 2016: One of my recent articles on The American Lawyer includes the most recent updates of the BEA data on the legal services industry (link here).]
[UPDATE January 23, 2014: The BEA has comprehensively revised its GDP by Industry accounts with updated definitions, classifications, and statistical methods that “supersede” all previous data. Importantly, the revision only covers the years from 1997 to 2012, but the bureau plans to update the older data in the future. The new existing data are discussed in this post, but this page will not be updated until the next phase of the revision occurs. The information presented here is out of date, but because I do not believe the final revision will significantly alter the underlying data, I believe the arguments presented in this page remain valid. Consequently, I will keep this page up in the meantime. Alternatively, you can see this post on household consumption of legal services.]
Every November the U.S. Bureau of Labor Statistics (BEA) updates its GDP-by-Industry data, which includes America’s legal sector. Often it revises the previous years’ numbers, but the general story is the same: Those who use lines like “Law is no longer a golden ticket” when writing on the legal education system’s problems do not realize that demand for private legal services has not been doing well for decades, and it has severely slumped since 2005, which I call the “Great Law Depression.” This static page reports on the most current BEA data to illustrate why the golden ticket lede is false—as well as why potential law school applicants should not expect a recovery any time soon.
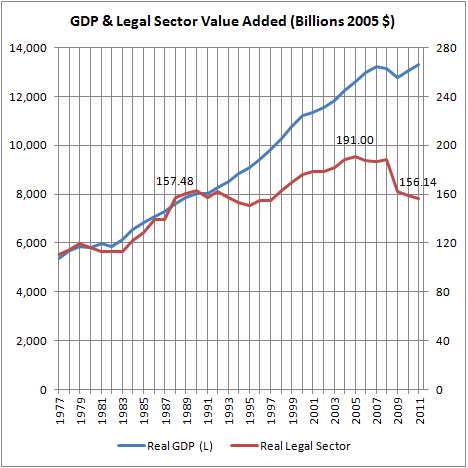
Here is the legal sector compared to GDP.
And here is a comparison of their growth rates.

How much of the Great Law Depression is due to cyclical factors and how much structural? To the extent it’s cyclical, a lot of people who’ve graduated from law school in recent years would have had lawyer jobs but don’t, and to the extent it’s structural, a lot of people never would have had lawyer jobs given law school over-enrollment. Depending on how much the price level of legal services changed over this time period, here are a few projections:
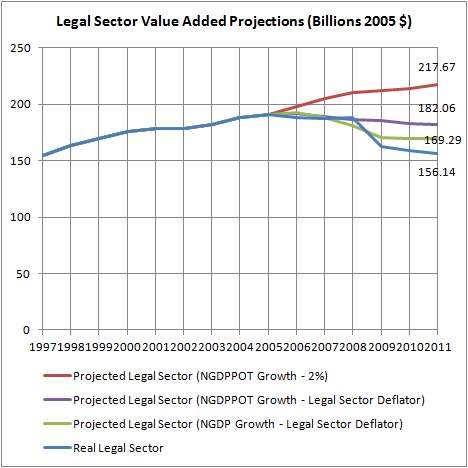
The conservative estimate says it’s down $25 billion in output, but if the recession caused the rise in the legal sector deflator, then it should be 40 percent higher than it really is. Here’s what I mean.

While it’s tempting to believe the price increases over the inflation rate over the decades is due to greedy lawyers (or student loan debt), it probably has more to do with income elasticity of demand for legal services. Put simply, people spend their last dollars on legal services, not their first. People who don’t have any assets don’t need wills; people who don’t get married don’t get divorced; and people who get arrested and can’t afford a lawyer will use a public defender instead. Fabulously wealthy corporations, by contrast, can always waste money on lawyers, just not enough to employ everyone who has a JD. This is a minor theme of The Law School Tuition Bubble: Those who want more affordable legal services for the poor are well advised to either pay for it out of their taxes or fight poverty directly. Forcing lawyers to do more pro bono work or shaming them into opening doomed practices simply will not help the poor.
As for the total compensation of jobs in the legal sector, it’s not been very good either:

Just using the GDP deflator, which is probably inadvisable, here’s what it looks like going back to the 1930s.
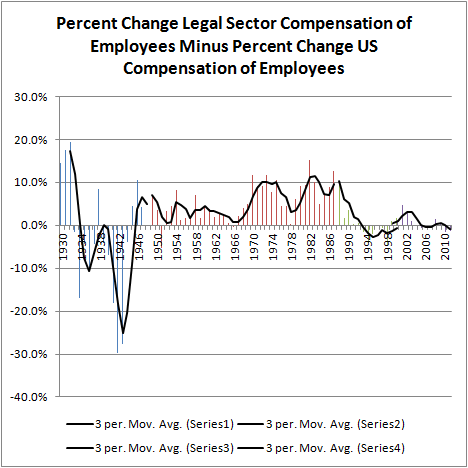

(Table 6.2 A-D)
The legal sector’s total compensation pool has still not been positive in recent years, so I’m incredulous that grads with even higher debt levels will have higher incomes than in the past.
Speaking of employment, the BEA tracks that too:
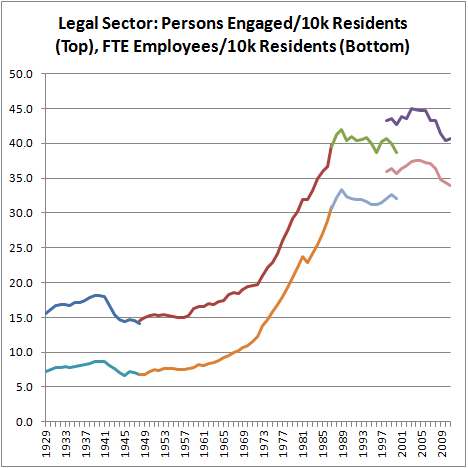

(Table 6.4 A-D (Dip in 2000 due to Census data revision))
According to the BEA, “persons engaged in industry” is the sum of full-time and part-time employees and self-employed workers, which indicates that the uptick in 2011 is exclusively among the self-employed. I’m not sure how reliable this estimate is, but it’s not a good sign for future law school graduates.
So, if the legal sector is set to rebound as law school applicants are often told, it has a very, very long way to go. It’s certainly not a persuasive reason for people to go to law school.
