After adjusting for inflation, private law school tuition appears to grow at a roughly linear rate, so don’t let anyone say it’s growing exponentially; it’s just not true.
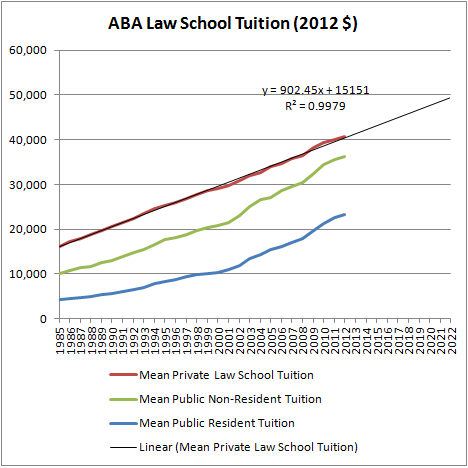
(Source: ABA)
Public law school tuition both for in-state and out-state students is affected by state government cuts to education subsidies, and the schools fill the shortfalls by raising their costs significantly. Consequently, future public law school tuition cannot be projected.
Why law school costs more than before shouldn’t be too difficult to figure out: Legal education isn’t a free market service. It’s heavily subsidized by the federal government, allowing law schools to raise their costs as long as students are willing to pay them. Even as enrollments decline, if nothing is done taxpayers will be left to cover law student debtors’ loans that are on income-sensitive repayment plans. Debtors whose loans are ineligible for IBR or ICR will require debt relief.
Because private law schools’ costs aren’t due to lost government subsidies, we can try to calculate their tuition going into the future. These tables project private law school tuition five and ten years from the last years for which I have been able to find data from the ABA-LSAC Official Guide to the ABA Law Schools (1999-2012). The methodology I used takes the average of the annual growth rate for each private law school’s tuition and then projects it into the future. The methodology differs from the linear regression model I used in previous years. I chose to change the methodology because it’s the most precise one I’ve been able to find. More information can be found here.
My methodology assumes that a law schools’ tuition will increase largely as it has in the past. This should be a somewhat controversial assumption as some law schools saw dramatic tuition increases in recent years, and the overall growth rates have fallen recently. Here are two charts of the dispersal of nominal tuition increases at private law schools since 1996.

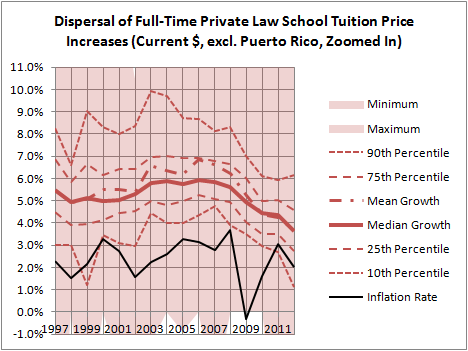
In 2012, the average nominal growth rate was below 4 percent, which is very low historically.
As an aid to readers, I’ve included a column on the right side of the table giving the “relative variance,” which is a measure of how (im)precise the projected tuition is based on the tests I ran. I think the lower it is the better. The idea is to give readers a measure of how reliable the estimate is, given that some law schools engaged in serious expansions in recent years that I doubt they could get away with now, especially Faulkner University, which doubled its tuition in the span of a few years.
These projections are not adjusted for inflation, and the table is sorted by the 2022-2023 academic year.
| # | SCHOOL | TUITION: 2012-2013 | TUITION: 2017-2018 | TUITION: 2022-2023 | RELATIVE VARIANCE |
|---|---|---|---|---|---|
| 1. | Cornell Law School (NY) | 55,301 | 66,744 | 78,188 | 0.4% |
| 2. | Columbia University (NY) | 55,488 | 65,840 | 76,191 | -1.0% |
| 3. | Yale Law School (CT) | 53,600 | 63,850 | 74,100 | 2.0% |
| 4. | Northwestern University (IL) | 53,468 | 63,706 | 73,943 | 1.0% |
| 5. | University of Pennsylvania (PA) | 53,138 | 63,164 | 73,190 | -0.8% |
| 6. | University of Southern California (CA) | 52,598 | 62,616 | 72,633 | 0.0% |
| 7. | Baylor University (TX) | 46,420 | 59,295 | 72,169 | -0.6% |
| 8. | Duke University (NC) | 51,662 | 61,492 | 71,323 | -0.2% |
| 9. | Harvard Law School (MA) | 50,880 | 60,560 | 70,241 | -0.3% |
| 10. | Yeshiva University (NY) | 50,046 | 59,984 | 69,923 | 0.7% |
| 11. | Brooklyn Law School (NY) | 50,001 | 59,949 | 69,898 | 0.9% |
| 12. | Stanford Law School (CA) | 50,802 | 60,204 | 69,605 | 0.5% |
| 13. | Seton Hall University (NJ) | 48,170 | 58,730 | 69,290 | 1.8% |
| 14. | New York Law School (NY) | 49,225 | 59,208 | 69,192 | 1.3% |
| 15. | New York University (NY) | 51,150 | 59,860 | 68,569 | 2.0% |
| 16. | University of Chicago (IL) | 50,727 | 59,629 | 68,531 | -2.5% |
| 17. | Fordham University (NY) | 49,526 | 58,946 | 68,365 | 0.8% |
| 18. | St. John’s University (NY) | 48,070 | 58,097 | 68,124 | 0.9% |
| 19. | Quinnipiac University (CT) | 47,076 | 56,876 | 66,677 | -0.2% |
| 20. | Georgetown University (DC) | 48,835 | 57,732 | 66,628 | -0.4% |
| 21. | Hofstra University (NY) | 47,660 | 57,050 | 66,440 | -0.4% |
| 22. | Washington University (MO) | 47,490 | 56,417 | 65,344 | 0.8% |
| 23. | Vermont Law School (VT) | 45,732 | 55,523 | 65,314 | 0.5% |
| 24. | George Washington University (DC) | 47,535 | 55,958 | 64,381 | -0.2% |
| 25. | American University (DC) | 46,794 | 55,526 | 64,259 | 0.1% |
| 26. | Faulkner University (AL) | 33,360 | 48,660 | 63,960 | 6.8% |
| 27. | Notre Dame (IN) | 45,980 | 54,947 | 63,913 | -2.0% |
| 28. | Vanderbilt University (TN) | 46,804 | 55,349 | 63,894 | 2.4% |
| 29. | Washington and Lee University (VA) | 43,462 | 53,189 | 62,917 | 1.1% |
| 30. | Syracuse University (NY) | 45,690 | 54,165 | 62,639 | 3.9% |
| 31. | Case Western Reserve University (OH) | 44,620 | 53,574 | 62,528 | -0.6% |
| 32. | Drexel University (PA) | 40,270 | 51,245 | 62,220 | -6.7% |
| 33. | Phoenix School of Law (AZ) | 39,533 | 50,426 | 61,319 | 1.3% |
| 34. | Southern Methodist University (TX) | 44,017 | 52,659 | 61,301 | -0.6% |
| 35. | Emory University (GA) | 45,098 | 53,185 | 61,273 | 3.9% |
| 36. | Pepperdine University (CA) | 44,980 | 53,103 | 61,226 | -1.2% |
| 37. | Suffolk University (MA) | 44,064 | 52,616 | 61,167 | 0.8% |
| 38. | California Western (CA) | 43,700 | 52,281 | 60,862 | 1.8% |
| 39. | Loyola Marymount (CA) | 44,230 | 52,476 | 60,722 | 1.2% |
| 40. | Southwestern University (CA) | 43,850 | 52,219 | 60,588 | 0.1% |
| 41. | University of San Diego (CA) | 43,860 | 52,218 | 60,575 | 1.0% |
| 42. | DePaul University (IL) | 43,220 | 51,828 | 60,435 | 0.5% |
| 43. | Chapman University (CA) | 43,536 | 51,954 | 60,371 | 0.1% |
| 44. | Santa Clara University (CA) | 43,680 | 52,018 | 60,357 | -0.6% |
| 45. | Charlotte School of Law (NC) | 38,606 | 49,404 | 60,201 | 1.6% |
| 46. | New England Law | Boston (MA) | 40,984 | 50,555 | 60,126 | 5.1% |
| 47. | Union University (NY) | 42,675 | 51,348 | 60,021 | 2.3% |
| 48. | University of New Hampshire (NH) | 41,190 | 50,455 | 59,721 | 1.7% |
| 49. | Touro College (NY) | 42,930 | 51,299 | 59,668 | 1.6% |
| 50. | Boston University (MA) | 44,168 | 51,890 | 59,613 | 0.1% |
| 51. | University of the Pacific (CA) | 43,045 | 51,257 | 59,469 | 0.0% |
| 52. | Thomas Jefferson School of Law (CA) | 42,000 | 50,423 | 58,846 | 1.8% |
| 53. | Tulane University (LA) | 43,684 | 51,144 | 58,604 | 3.7% |
| 54. | Loyola University New Orleans (LA) | 41,448 | 49,893 | 58,337 | -3.9% |
| 55. | University of Miami (FL) | 42,938 | 50,591 | 58,244 | -3.9% |
| 56. | Boston College (MA) | 43,511 | 50,806 | 58,100 | -0.6% |
| 57. | Golden Gate University (CA) | 42,010 | 50,045 | 58,079 | 0.3% |
| 58. | Northeastern University (MA) | 43,048 | 50,559 | 58,070 | 1.9% |
| 59. | University of San Francisco (CA) | 42,364 | 50,060 | 57,756 | -0.7% |
| 60. | Illinois Institute of Technology (IL) | 42,030 | 49,813 | 57,595 | 4.0% |
| 61. | University of La Verne (CA) | 40,732 | 49,000 | 57,269 | 4.9% |
| 62. | Catholic University of America (DC) | 43,245 | 50,227 | 57,209 | 0.4% |
| 63. | Pace University (NY) | 42,198 | 49,590 | 56,981 | 0.7% |
| 64. | Roger Williams University (RI) | 40,930 | 48,922 | 56,915 | 0.6% |
| 65. | University of St. Thomas (MN) | 39,244 | 47,895 | 56,546 | -7.5% |
| 66. | University of Denver (CO) | 39,840 | 48,163 | 56,486 | 0.9% |
| 67. | Seattle University (WA) | 39,884 | 47,865 | 55,846 | 2.7% |
| 68. | Florida Coastal (FL) | 39,370 | 47,458 | 55,547 | -2.2% |
| 69. | John Marshall (Chicago) (IL) | 39,884 | 47,655 | 55,426 | -0.4% |
| 70. | Western New England College (MA) | 39,574 | 47,160 | 54,746 | 0.5% |
| 71. | Valparaiso University (IN) | 38,852 | 46,704 | 54,555 | 2.2% |
| 72. | Whittier Law School (CA) | 40,260 | 47,308 | 54,357 | 0.8% |
| 73. | John Marshall (Atlanta) (GA) | 36,183 | 45,207 | 54,230 | 1.4% |
| 74. | University of Detroit Mercy (MI) | 38,180 | 46,168 | 54,157 | -1.5% |
| 75. | Loyola University Chicago (IL) | 40,582 | 47,340 | 54,099 | 0.7% |
| 76. | Western State University (CA) | 39,600 | 46,777 | 53,954 | -2.4% |
| 77. | Elon University (NC) | 36,100 | 44,975 | 53,850 | 0.8% |
| 78. | Marquette University (WI) | 38,690 | 46,225 | 53,759 | 1.1% |
| 79. | Villanova University (PA) | 38,910 | 46,152 | 53,395 | 0.9% |
| 80. | Charleston Law School (SC) | 37,874 | 45,536 | 53,197 | 1.4% |
| 81. | Wake Forest University (NC) | 39,190 | 46,090 | 52,990 | 2.6% |
| 82. | Lewis & Clark College (OR) | 38,180 | 45,488 | 52,795 | -0.9% |
| 83. | Widener University (DE) | 38,250 | 45,442 | 52,635 | -1.0% |
| 84. | Widener University (Harrisburg) (PA) | 38,250 | 45,442 | 52,635 | -1.0% |
| 85. | Thams M. Cooley Law School (MI) | 37,140 | 44,746 | 52,352 | -3.7% |
| 86. | Ave Maria School of Law (FL) | 37,270 | 44,780 | 52,290 | 2.0% |
| 87. | Mercer University (GA) | 37,260 | 44,187 | 51,114 | 2.9% |
| 88. | Hamline University (MN) | 36,396 | 43,666 | 50,937 | -1.2% |
| 89. | Michigan State University (MI) | 35,377 | 42,888 | 50,399 | 6.0% |
| 90. | Duquesne University (PA) | 35,354 | 42,635 | 49,916 | -0.4% |
| 91. | University of Richmond (VA) | 36,850 | 43,354 | 49,858 | -0.4% |
| 92. | William Mitchell College of Law (MN) | 36,020 | 42,905 | 49,789 | 3.2% |
| 93. | Saint Louis University (MO) | 36,885 | 43,329 | 49,773 | 1.7% |
| 94. | Samford University (AL) | 36,216 | 42,847 | 49,478 | -0.1% |
| 95. | Campbell University (NC) | 35,340 | 42,111 | 48,882 | -0.2% |
| 96. | Drake University (IA) | 35,282 | 42,071 | 48,860 | 0.3% |
| 97. | Regent University (VA) | 34,405 | 41,536 | 48,667 | -0.6% |
| 98. | Oklahoma City University (OK) | 34,290 | 41,267 | 48,245 | 8.1% |
| 99. | Stetson University (FL) | 36,168 | 42,194 | 48,220 | 1.5% |
| 100. | Gonzaga University (WA) | 35,460 | 41,625 | 47,791 | -0.4% |
| 101. | St. Thomas University (FL) | 36,226 | 41,794 | 47,361 | -1.5% |
| 102. | Willamette University (OR) | 34,690 | 40,963 | 47,236 | -2.8% |
| 103. | Capital University (OH) | 33,263 | 39,911 | 46,558 | 2.4% |
| 104. | Howard University (DC) | 31,640 | 38,892 | 46,144 | -3.6% |
| 105. | Creighton University (NE) | 33,490 | 39,788 | 46,087 | 0.9% |
| 106. | Barry University (FL) | 34,300 | 40,120 | 45,940 | 1.6% |
| 107. | Appalachian School of Law (VA) | 31,525 | 38,491 | 45,457 | -1.1% |
| 108. | Nova Southeastern University (FL) | 34,330 | 39,853 | 45,376 | 0.1% |
| 109. | Liberty University (VA) | 32,002 | 38,600 | 45,197 | -0.3% |
| 110. | Ohio Northern University (OH) | 33,684 | 39,316 | 44,949 | 0.6% |
| 111. | University of Dayton (OH) | 33,630 | 38,901 | 44,172 | -3.1% |
| 112. | University of Tulsa (OK) | 31,836 | 37,516 | 43,197 | 4.6% |
| 113. | Texas Wesleyan University (TX) | 30,580 | 36,588 | 42,595 | -2.1% |
| 114. | St. Mary’s University (TX) | 30,566 | 36,122 | 41,678 | -0.2% |
| 115. | Mississippi College (MS) | 29,450 | 35,478 | 41,505 | 3.3% |
| 116. | South Texas College of Law (TX) | 27,600 | 32,008 | 36,415 | 0.5% |
| 117. | Brigham Young University (UT) | 21,900 | 27,238 | 32,577 | 1.8% |
| MEDIAN | 40,930 | 49,813 | 57,756 | 0.5% | |
| MEAN AVERAGE | 41,132 | 49,240 | 57,349 | 0.5% | |
| AVG DEVIATION | 5,131 | 6,019 | 7,116 | 1.6% | |
*****
Finally, because the tuition growth rates have dropped recently, I might not repeat this project in 2014. It’s important to me that the projections not sensationalize and overshoot law schools’ sticker prices in the future, no matter how precise the methodology.

One comment