In the famous original Star Trek episode “Miri,” the Enterprise happens upon a world that is exactly like Earth in the 1960s (boy that gimmick got old), except the only people alive are a handful of children. The grown-ups—”grumps”—all died due to a deadly disease that was supposed to make everyone immortal. “Miri”‘s children, however, were hundreds of years old because they only aged one month per year.
Wackiness ensued.
Worse than life imitating art, children in the United States of America could only dream of living on the pseudo-Earth in “Miri.” This week, the Census Bureau updated its “Income, Poverty and Health Insurance Coverage” page for 2012, and most of the focus has been on the cratered real median family incomes. Indeed, last year the median family income was less than what it was in 1989. Heckuva job.
But I’m not here to dumpster-dive into Census data to comment on families’ incomes; rather, the update’s relevance to me is the 2012 person income tables, which contains the ever-so-useful PINC-03: “Educational Attainment—People 25 Years and Older, by Total Money Earnings in 2012, Work Experience in 2012, Age, Race, Hispanic Origin, and Sex.” PINC-03 goes back in some form or another to 1994, and it gives us personal earnings data on Americans in the 25 to 34 age bracket by educational attainment, courtesy of the Household Survey. It is awesome.
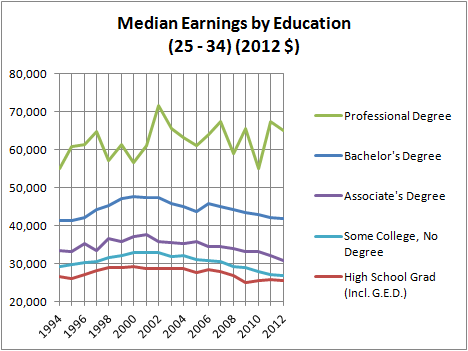
To get things rolling, here’s a chart showing the dispersion of incomes by education (with medians drawn in) in 2012 and a blow-up version to better show the LSTB’s favorite category, professional degrees:

![Dispersal of Earnings by Education (25 -34) [Blow-Up]](https://lawschooltuitionbubble.files.wordpress.com/2013/09/dispersal-of-earnings-by-education-25-34-blow-up.png?w=620)
The PINC-03 tables measure incomes in $2,500 brackets, stopping at $99,999. After that they lump all incomes above $99,999 that into one category. Here’s a comparison:
So what does the 2012 update add to the time series data beginning in 1994? Why, mass unemployment and declining incomes for young Americans!
One of the neat tricks the government uses to buoy median incomes is to exclude people who have $0 earnings from the population (the denominator), figuring that we can’t tell whether people choose to leave the workforce or are involuntarily unemployed (because, you know, unemployment is voluntary). Excluding zero-earners makes less and less sense as we go up the education scale. Like, come on Census, you really expect us to believe that 12 percent of the people with professional degrees took on all that education debt and sacrificed prime working years just to earn nothing last year?

As you can see in these last two charts, the professional degree-holder data are much noisier than the other categories, the reason being that they only comprise 1 percent of the 25 to 34 bracket. Small sample sizes bedevil us. The remaining categories I’ve depicted are all greater than 10 percent, so they’re likely more precise.
Now you might be asking, “Hey LSTB, how many college graduates are earning less than the median high school graduate?” and you would be clever for doing so, for the answer indicates that for many young Americans college does not provide a “premium,” unless you think being less unemployed than a high school graduate is an accomplishment. Because the PINC-03 tables provide the number of people by $2,500 earnings bracket, the next chart shows the floors and ceilings for how many people are above or below the median.

Ouch.
Now, another brief digression on professional degree-holders in the 25 to 34 bracket. Probably a substantial majority of them are law school graduates. I suspect that because according to the Digest of Education Statistics law grads dominate the 10-year degrees-conferred rate for professional school graduates.

(Source: Table 322, author’s calculations)
One thing to note is that while the 10-year degrees rate for the last couple of years has been nearly 900,000, the number of 25- to 34-year-olds in the PINC-03 tables with such degrees is usually half that. Either the Household Survey is consistently imprecise, wantonly excluding many professionals, or non-law school professionals don’t obtain their degrees until much later than 25. If the latter is true, then the “professional degrees” category in the 25 to 34 bracket is even more law grad-heavy than the rest of the population, justifying my hunch that “professional school grads” in these charts means law degree-holders and a handful of doctors.
So, here’s the percentage of professional school grads who earn less than bachelor’s degree-holders and high school graduates, aka The End of All Things.
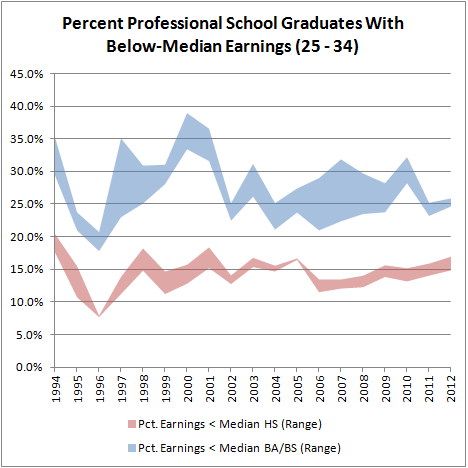
Three in twenty professional school graduates who have earnings at all earn less than the median high school graduate of the same age bracket, and one in eight of the total earns nothing. That’s a quarter of the total making less than the median high school graduate who has earnings. I’m not the first person to point this out, but no one goes to a professional school program to drop out of the workforce or be severely underemployed. If they do, then we’re way into credential inflation territory. And no, these people are not all in low-paying non-profit gigs, and if you say they’re going back to school to get better degrees, you get a grade-inflation immune “F”.
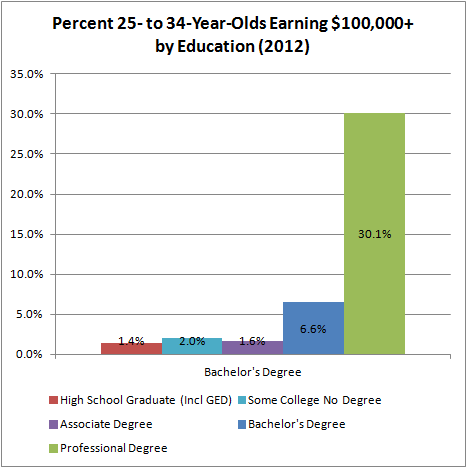
One more pair of charts, the percent of 25- to 34-year-olds with earnings greater than $100,000, adjusted for inflation.

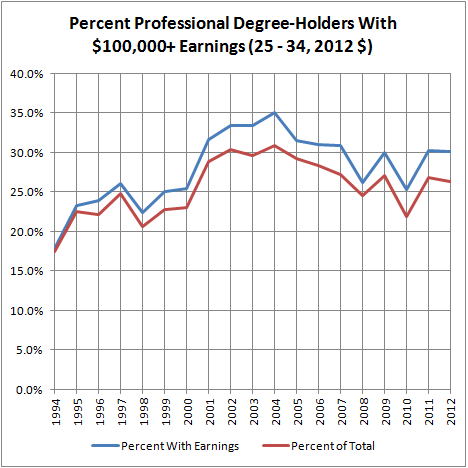
NALP, eat your heart out.
The collapsed earnings for young people depicted in these charts are among the most discouraging things I’ve ever seen since I started this blog. It’s as if the Grumps’ ultimatum to young Americans is: Either acquiesce to your stolen futures or don’t grow up at all. “Planet ‘Miri’ or Bust!”
Gene Roddenberry would roll in his grave if his ashes hadn’t been dumped into space.